
Working Capital Metrics and KPIs – Definition, formula, and considerations
This article will showcase 10 common working capital metrics and KPIs, including their respective definition, formula and application.
Furthermore, it will briefly comment on what to consider when monitoring and tracking working capital. The article will also explain why companies should look beyond its balance sheet and profit and loss statement to fully understand and manage its performance.
Key Take Aways
- In today’s competitive and complex business landscape, the adept utilization of resources stands as a cornerstone for success.
- Working capital key performance indicators (KPIs) serve as crucial tools for overseeing a company’s liquidity, operational efficiency, and overall financial health.
- It’s imperative for companies to monitor and track both their working capital and operating working capital, considering strategic, tactical, and operational aspects, to ensure sustained growth and resilience.
- Working capital KPIs must always be evaluated against the level of working capital a company requires to effectively support its operations.
- While individual reporting periods can provide valuable insights, looking at trends over time is crucial for a more comprehensive understanding.
- Also, companies should look beyond its balance sheet and profit and loss data, to fully understand its working capital performance.
- To ensure effective follow-up and control, companies must also analyze transactional data, which provides deeper insights into operations and helps drive resilience, innovation, and growth.
Why measure Working Capital?
In today’s increasingly competitive and complex business environment, the significance of maintaining and optimizing working capital cannot be overstated. Companies financial prosperity therefore hinges more than ever on the ability to manage their resources effectively.
Strong working capital management is about ensuring a company is utilizing its current assets and current liabilities as efficiently and effectively as possible.
- [Strategic] Making sure the operating working capital support a company’s overall strategic direction, and generates a desired return.
- [Tactical] Making sure a company’s working capital facilitates sufficient cashflow to meet its short-term operating costs and short-term debt obligations.
- [Operational] Making sure a company’s operating working capital supports day-to-day operations.
The hallmark of strong business practices is the ability to manage its working capital in a way that allows the company to maintain a solid balance between liquidity, growth, and profitability.
Note that to effectively capture all three perspectives, a company must track and manage both its working capital and its operating working capital.
Learn more about Working Capital metrics and KPIs – take our accredited e-learning course Managing Working Capital on MyAcademyHub.com!
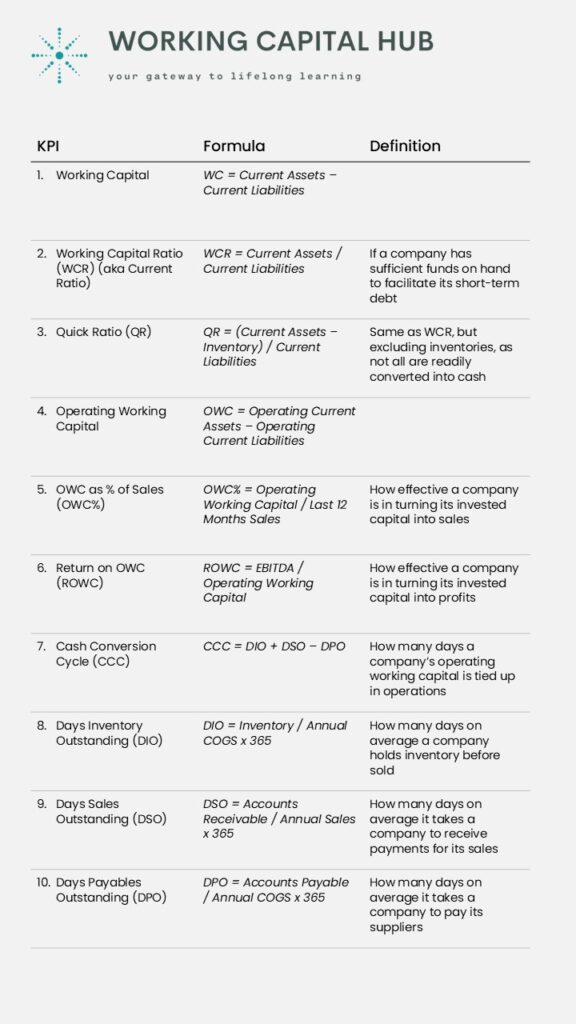
10 common Working Capital metrics and KPIs
1. Working Capital (WC)
The working capital metric tells if a company holds sufficient cash and cash equivalents to pay its short-term financial obligations. (Its liquidity)
The formula for calculating working capital is:
WC = Current Assets – Current Liabilities
Where:
Current Assets = Inventory + Accounts Receivable + Supplier Prepayments + Accrued Income + Other Current Assets + Cash
And:
Current Liabilities = Accounts Payable + Customer Prepayments + Current Debt + Tax Liabilities + Other Current Liabilities
2. Working Capital Ratio (Current Ratio)
The working capital ratio (also called the current ratio) is a measure of a company’s liquidity, calculated by dividing its current assets by its total liabilities.
The formula for calculating the working capital ratio is:
Working Capital Ratio = Current Assets / Current Liabilities
The working capital ratio helps illustrate how much of a company’s revenues will be used to meet payment obligations in the period. And, consequently, it shows how much cash the company will have left for new opportunities such as financing growth or capital investments.
- A working capital ratio greater than 1 indicates that the company has more current assets than current liabilities.
- A ratio between 1.5 and 2 is generally considered good, as it suggests the company has sufficient funds on hand to facilitate its short-term debt and at the same time provide flexibility to finance growth and investments.
- A ratio greater than 3 can at the same time suggest that a company is not utilizing its assets effectively. Too high levels of idle capital indicate an inefficient use of resources.
However, the working capital ratio is by itself not a complete representation of a company’s short-term liquidity or longer-term solvency, as it at any time only provides a snapshot of performance. Also, it does not consider the quality of current assets and includes items that may not be easily converted into cash, such as slow moving or obsolete inventories.
3. Quick Ratio (QR)
The quick ratio (also called acid-test ratio) is like the working capital ratio, a measure of a company’s liquidity.
It is however a more conservative measure as it excludes inventory from current assets, as inventories may not be as easily convertible to cash or may require substantial discounts to liquidate.
The formula for calculating the quick ratio is:
Quick Ratio = (Current Assets – Inventory) /Current Liabilities
The quick ratio provides a clearer picture of a company’s ability to meet short-term obligations without relying on selling inventory. A higher cash ratio indicates a stronger ability to cover short-term liabilities.
4. Operating Working Capital (OWC)
The Operating Working Capital metric looks at how effectively a company utilizes the capital it has tied up in operations.
The formula for calculating operating working capital is:
OWC = Operating Current Assets – Operating Current Liabilities
Where:
Operating Current Assets = Inventory + Accounts Receivable + Supplier Prepayments (+ accrued income)
And:
Operating Current Liabilities = Accounts Payable + Customer Prepayments
5. Operating Working Capital as % of sales (OWC%)
Operating working capital should always be evaluated in relation to the business it is supporting. OWC divided by sales is therefore a common metric, showing how effectively a company can convert its invested operating working capital into sales.
The formula for calculating OWC% is:
OWC% = OWC / Last 12 months Sales
This relative measurement is effective when following progress over time, visualizing a company’s aggregated operating working capital performance and its trend.
The higher the sales a company can generate from its operating working capital, the more efficient and effective it is.
It can also be used to benchmark against relevant peers. However, as always, benchmarks should be approached with caution, as it can be difficult finding relevant companies to compare to.
6. Return on Operating Working Capital (ROWC)
This metric is a measure of how effective a company is in turning its invested capital into profits.
The formula for calculating ROWC is:
ROWC = EBITDA / Operating Working Capital
At a minimum, a company’s return on operating working capital should be more than its cost of capital. If not, the company should look for better ways of generating value.
7. Cash Conversion Cycle (CCC)
The cash conversion cycle metric is a measure of how many days a company’s operating working capital is tied up in operations before converted into cash.
The CCC encapsulates three key stages of a company’s operating cycle:
- The selling of current inventories.
- The collection of cash from current sales.
- The payment to suppliers or goods and services purchased.
The CCC is therefore calculated using three other operating working capital metrics:
- DIO – Days Inventory Outstanding
- DSO – Days Sales Outstanding
- DPO – Days Payable Outstanding
DIO and DSO are short-term assets, while DPO is classed as a liability.
The formula for calculating CCC is:
CCC = DIO + DSO – DPO
The shorter the cycle, the quicker it can convert its invested operating capital into cash, through selling off its inventories, receiving payments from customers, while paying suppliers in a timely manner. Read more about the cash conversion cycle here.
8. Days Inventory Outstanding (DIO)
The Days Inventory Outstanding metric is a measure of how many days on average a company holds inventory before sold.
The formula for calculating DIO is:
DIO = Inventory / Annual cost of goods sold (COGS) x 365
Looking at inventory performance as days rather than turns provides a deeper understanding of inventory management efficiency. This is because inventory days can be directly compared to a company’s replenishment- or production lead-times.
Pro-tip: Break down DIO between raw materials, WIP and finished goods for deeper insights. Also, consider using different denominators between the three for more accurate representation.
- Raw Materials – calculate days using material cost only.
- WIP – calculate days days using an average of material cost and total COGS.
- Finished Goods – calculate days based on COGS.
Inventory days help identify discrepancies between ideal inventory levels and the time it takes a company to restock or produce.
- A company’s DIO should always be evaluated against its ideal inventory level.
- A low DIO indicates that a company turns its inventory into sales at a high pace.
- A high DIO indicates that a company is not able to quickly turn its inventory into sales. This can be due to poor sales performance or the purchase of too much inventory.
9. Days Sales Outstanding (DSO)
The Days Sale Outstanding metric is a measure of how many days on average a company takes to receive payments for its sales.
The formula for calculating DSO is:
DSO = Accounts Receivable / Annual Sales x 365
Looking at accounts receivable performance as days rather than turns provides a deeper understanding of receivables management efficiency. This is because receivables days can be directly compared to a company’s customer payment terms.
Receivables days therefore help identify discrepancies between contractual customer terms and the time it takes a company to collect its receivables.
- A company’s DSO should always be evaluated against its weighted average customer payment term.
- A low DSO indicates that a company can negotiate favorable payment terms with its customers, and that customers pay on time.
- A high DSO indicates longer customer payment terms, and/or that the company is experiencing delays in receiving payments.
10. Days Payable Outstanding (DPO)
The Days Payable Outstanding metric is a measure of how many days on average it takes a company to pay its suppliers.
The formula for calculating DPO is:
DPO = Accounts Payable / Annual COGS x 365
Looking at account payable performance as days rather than turns provides a deeper understanding of a company’s efficiency. This is because payable days can be directly compared to a company’s supplier payment terms.
Pro-tip: Consider isolating the purchasing-spend portion of COGS and use as denominator for more accurate representation of account payable days.
Payables days help identify discrepancies between contractual supplier terms and the time it takes a company to pay its supplier invoices.
- A low DPO indicates shorter supplier payment terms, or that the company is paying its suppliers earlier than required.
- A company’s DPO should always be evaluated against its weighted average supplier payment term.
- A high DPO indicates that the company can negotiate longer supplier payment terms, and/or that the company is delaying its supplier payments.

Interpreting Working Capital metrics and KPIs
Working capital metrics and key performance indicators (KPIs) must always be evaluated against the level of working capital a company requires to effectively support its operations. Read more about a company’s working capital Setpoint here.
It is therefore essential to consider factors such as industry and business model, a company’s size and growth stage, as well as any seasonality and cyclical trends.
While individual reporting periods can provide valuable insights, looking at trends over time is crucial for a more comprehensive understanding. This will help identify patterns and understand cyclical variations.
This in turn will help improve forecasting accuracy and help make more informed decisions.

Become an expert in working capital transaction data analysis – our master classes in transaction data analysis will come soon to MyAcademyHub. Stay tuned!
Limitations of balance sheet KPIs
While KPIs from a company’s balance sheet and P&L statement offer some insights, they often fail to fully capture the quality and performance of working capital. Several factors contribute to this:
- Mismatch between metrics: P&L items like revenues and costs don’t always align with balance sheet items. For example, reported material costs may not match purchased materials, as costs are recognized upon consumption, not purchase.
- Complex reporting structures: Identifying relevant revenue and cost accounts for working capital metrics can be complex and subjective. Consistency is key for accuracy.
- Periodic data distortion: Balance sheets typically show month-end figures, ignoring transactions between reporting dates. This can distort metrics like late receivables/payables.
- Lack of granularity: Balance sheet KPIs give broad averages, masking variations in individual working capital components. Averages can hide poor performance behind overachievers.
- Slow trend detection: KPIs based on longer periods may miss sudden deviations or emerging trends, limiting the ability to drill down into key drivers like product, customer, or supplier changes.
These limitations can cause stakeholders in the operating working capital cycle to disconnect from the reported numbers, making it difficult to create ownership and urgency within their teams.
However, balance sheets and profit and loss statements remain critical. Indirect stakeholders, such as owners and banks, rely on these metrics to assess a company’s viability for investments or loans. They provide essential data and benchmarks for evaluating past performance and projecting future outcomes.
While these KPIs are important, they shouldn’t be the only metrics used for decision-making. To ensure effective follow-up and control, companies must also analyze transactional data, which provides deeper insights into operations and helps drive resilience, innovation, and growth.
Eager to learn more? Check out our accredited e-learning course Managing Working Capital

Leave a Reply